
Open any crypto app and most people check two things: the price and the percentage change. But price only tells you where the market is. The numbers sitting quietly beside it tell you what's happening.
Why can a token trading at a penny be "overvalued"? Why does the market suddenly wick down and wipe out thousands of long positions in a rally? The answers are in the data.
Key takeaways
- Don't judge a token by its unit price. Look at market cap and fully diluted valuation (FDV).
- A rally on rising volume is more convincing than one on falling volume, but watch for fake volume.
- Funding rates show how crowded each side is; extremes often come before big moves.
- Pair open interest with price to see whether money is entering or leaving.
- No single metric predicts price.
Market cap and fully diluted valuation
A low price doesn't mean cheap. A token at $0.01 with 100 billion coins in existence is valued at $1 billion. Market cap is what tells you whether something is expensive.
- Circulating market cap = price × circulating supply. The value of tokens actually trading today.
- Fully diluted valuation (FDV) = price × maximum (or total) supply. What the project would be worth if every token were already released.
Here's an example:
| Item | Value |
|---|---|
| Price | $1 |
| Circulating supply | 100 million |
| Max supply | 1 billion |
| Circulating market cap | $100 million |
| FDV | $1 billion |
Only 10% of tokens are in circulation, so 900 million more will unlock over time. If demand doesn't keep up, that new supply weighs on the price. It's one reason so many "low float, high FDV" tokens slide steadily after launch. Always check a project's token unlock schedule.
Volume: how hot is the market?
Volume measures activity: how much money is actually changing hands.
| Price | Volume | Typical reading |
|---|---|---|
| Up | Rising | Strong buying; the move is more convincing |
| Up | Falling | Few buyers following; momentum may fade |
| Down | Rising | Panic selling or large holders exiting |
| Down | Falling | Selling pressure easing; the market may be waiting |
A handy ratio is volume ÷ market cap, similar to turnover in stocks. Higher means more active trading, but an unusually high ratio on a small token can signal hype or manipulation.
Some platforms also inflate their volume with wash trading. Comparing several data sources and checking order book depth is more reliable than trusting one exchange's numbers.
Bitcoin dominance
Bitcoin dominance = bitcoin's market cap ÷ the total crypto market cap.
Traders watch it to see money rotate between bitcoin and everything else ("altcoins"). Rising dominance often means money is moving toward bitcoin as the relatively safer bet; falling dominance can mean traders are chasing riskier altcoins, the so-called "altseason." It's a useful lens, not a crystal ball.
Funding rates on perpetual futures
Perpetual futures never expire, so exchanges use funding rates to keep their price close to the spot price. Longs and shorts pay each other periodically, typically every 8 hours on many exchanges.
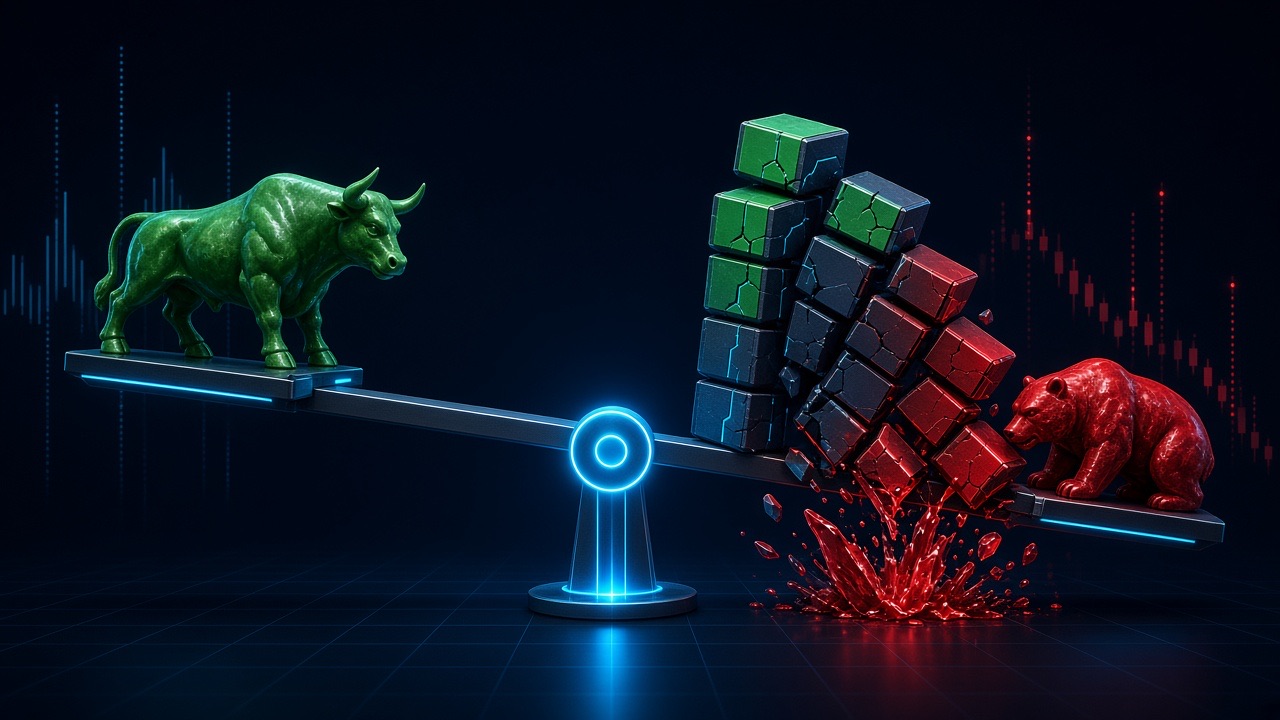
- Positive funding: longs pay shorts, meaning more traders want to be long.
- Negative funding: shorts pay longs, meaning more traders want to be short.
Small numbers add up fast. A common rate of 0.01% every 8 hours is 0.03% a day, or roughly 10.95% a year. At 0.1% every 8 hours, holding a long for a year would cost more than 100%.
When funding stays extreme, one side of the market is crowded with leverage. A small move the other way can set off a chain of liquidations. That's why crowded longs so often end with a sudden flush.
Open interest and liquidations
Open interest (OI) is the total value of futures contracts that are still open: how much money is currently betting on the market. Combined with price, it becomes far more useful:
| Price | Open interest | Typical reading |
|---|---|---|
| Up | Rising | New longs entering; the rally has fresh money behind it |
| Up | Falling | Shorts being forced out (a short squeeze); may not last |
| Down | Rising | New shorts entering; bearish conviction growing |
| Down | Falling | Longs closing or getting liquidated; a possible flush-out |
A sharp drop in open interest usually means a wave of liquidations. Most beginners who get liquidated underestimated leverage:
| Leverage | Adverse move that can liquidate you (rough estimate) |
|---|---|
| 5× | About 20% |
| 10× | About 10% |
| 20× | About 5% |
| 100× | About 1% |
In practice, maintenance margin and fees push your liquidation price even closer. Daily swings of 5–10% are common in crypto, and one sharp wick is enough to wipe out a high-leverage position.
Long/short ratio and the Fear & Greed Index
- Long/short ratio: the share of accounts (or positions) that are long versus short. It reflects crowd sentiment, not where the price is going, and many traders read it as a contrarian signal.
- Fear & Greed Index: combines volatility, volume, social media activity and more into a 0–100 sentiment score. Extreme fear tends to coincide with everyone being bearish; extreme greed, with everyone chasing.
On-chain data
Because blockchains are public, you can watch money move directly:
- Exchange net flows: large inflows to exchanges can signal that holders are getting ready to sell; steady outflows to private wallets are often read as long-term holding.
- Stablecoin supply: a growing stablecoin supply suggests more "dry powder" waiting on the sidelines.
- Active addresses: a measure of real network usage that often says more about adoption than price does.
FAQ
Where can I find this data?
Market cap, volume and FDV are on sites like CoinGecko and CoinMarketCap. Funding rates, open interest and liquidation data are on exchange futures pages and dedicated derivatives dashboards. For on-chain data, use block explorers and on-chain analytics platforms.
Is a cheap token more likely to hit $1?
Not necessarily. Market cap, not unit price, determines how much room a token has. A token with 100 billion coins reaching $1 would need a $100 billion market cap, putting it among the largest assets in crypto.
Should I short when funding rates are high?
It's not that simple. High funding means longs are crowded, but in a strong trend it can stay high for a long time. Trading on a single indicator is a fast way to get burned.
What's the difference between spot and futures?
Spot means you actually own the token; if the price drops, you still hold it. Futures let you bet on price with leverage, and if the market moves far enough against you, your position is force-closed and you can lose your entire margin. Beginners should stay away from high leverage.
Summary
Price is the result; data is the story behind it. Market cap and FDV tell you what a project is worth, volume tells you how hot it is, funding and open interest tell you how crowded the leverage is, and on-chain data tells you where the money is flowing.
No single metric can predict price. Read them together, understand what each one means and you'll judge the market more objectively, with less emotion. New to crypto? Start with What Is Bitcoin?. Futures trading is extremely risky. This article is for education only and isn't investment advice.

Covers the markets desk: market cap, volume, funding rates and on-chain data, turning complex indicators into conclusions everyday readers can follow.
Our editorial principles →
 Michael Carter

 Emily Parker